Scientific ploting guide
Genreal idea
- Ticks pointing inward.
- labels with different linestyle, colors, etc.
- large text size in labels, usually larger than the text surrounding.
- Use tight layout for the figure. e.g.
plt.savefig('../test.pdf',bbox_inches='tight') - Remember to add legend if you have multiple data in the same plot.
Reference
- Scientific plot package.
- One example by the developer of the package.
- Guide from Matplotlib.
- Others, 1.
Advanced techniques
- Zoom in for one plot. See reference here.
Jupyter Tips
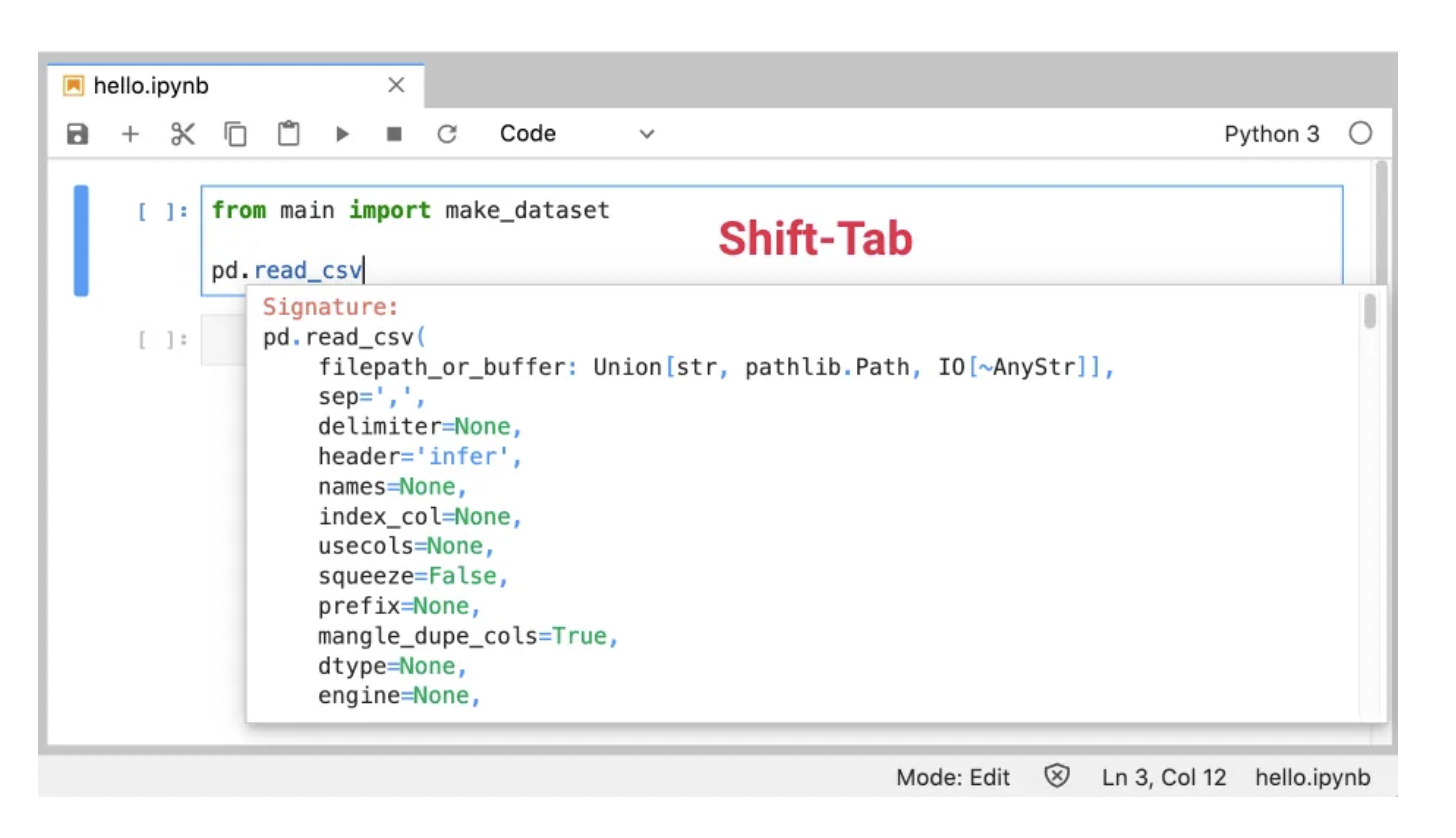
Tooltip Pressing Shift-Tab will show a tooltip for the function or class your cursor is on:
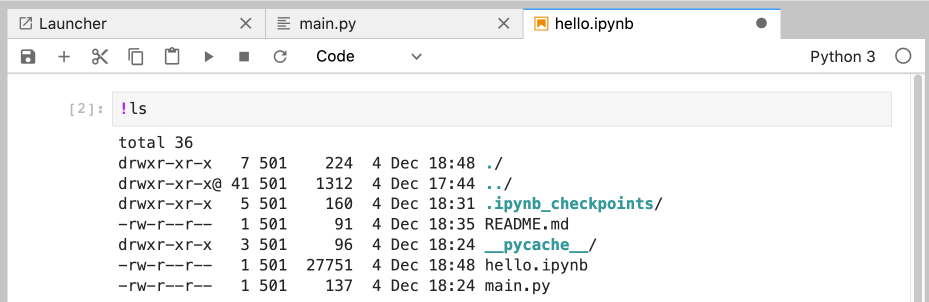
Another iPython feature - running shell commands inside a notebook:
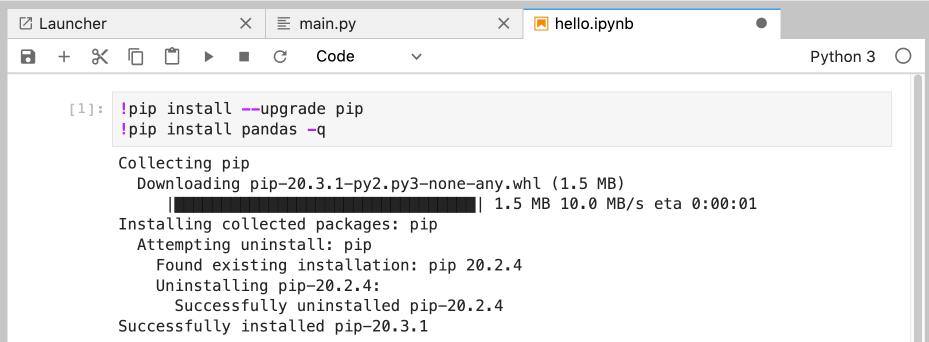
You can use this to automatically install packages in the first cell of a notebook — make sure to use the -q flag to hide the output:
Jupyter Lab Keyboard Shortcuts Cheat Sheet
Below is a list of the most useful keyboard shortcuts in Jupyter Lab:
Cmd B= toggle sidebarAlt W= close tabEnter= to move from Command to EditEscape= to move from Edit to CommandShift Enter= run cell
Command Mode
- a = insert cell above - b = insert cell below - d = delete cell - z = undo cell - shift z = redo cell - m = change cell to Markdown - y = change cell to code
Text mode
- Cmd Z = undo text - Shift Cmd Z = redo text